Recent searches
Search options

Administered by:


#Eurostat


Greece Ranks Near Bottom Of EU In Purchasing Power, Eurostat Data Reveals https://www.byteseu.com/874052/ #Bulgaria #DebtCrisis #EconomicStruggle #EURanking #EuropeanUnion #Eurostat #GDP #Greece #GreeceNews #Ireland #Luxembourg #MitsotakisGovernment #PurchasingPower #SouthernEurope #supermarket


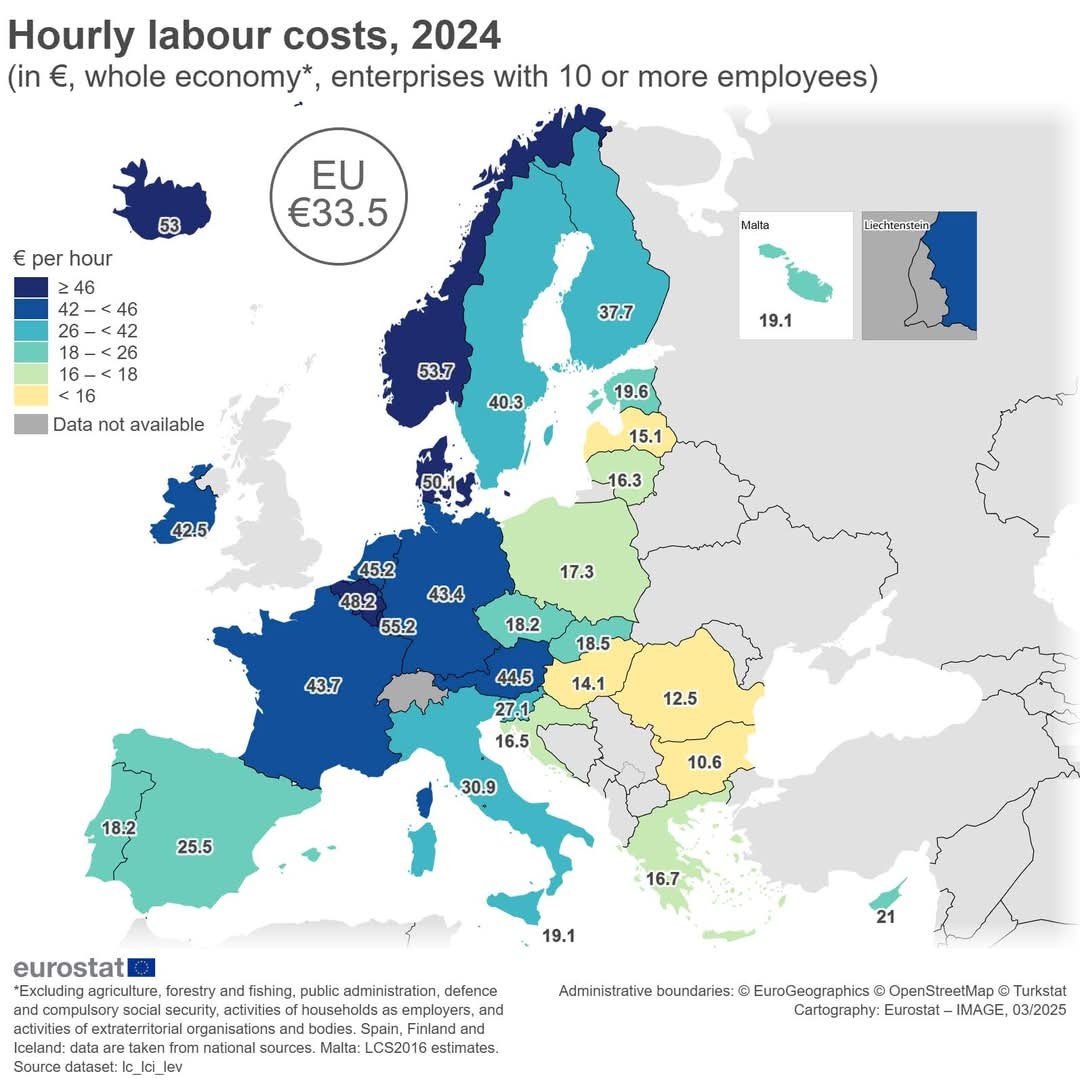
#Eurostat: In 2024, the average hourly #labour costs in the whole #economy were estimated to be €33.5 in the #EU and €37.3 in the euro area.
 Czech Republic €18.2
Lowest hourly labour #costs recorded in: Bulgaria (€10.6)
 Romania (€12.5)
 Hungary (€14.1)
Highest in: Luxembourg (€55.2)
 Denmark (€50.1)
 Belgium (€48.2)
Find out more  https://ec.europa.eu/eurostat/en/web/products-eurostat-news/w/ddn-20250328-1

https://www.europesays.com/1949151/ Luxembourg and Ireland Lead EU in GDP Per Capita, Croatia Narrows Gap #croatia #EconomicGrowth #EUEconomy #EUGDPPerCapita #eurostat #GDPRankings #hrvatska #hungary #ireland #luxembourg #PurchasingPower #vijesti


https://www.europesays.com/1917991/ più disoccupati da giovani e donne #disoccupazione #eurostat #Italia #italy #lavoro #notizie #UnioneEuropea

 #UniuneaEuropeană a înregistrat anul trecut un excedent comercial de 198,2 miliarde
  #EUR în relația cu
  #SUA, arată o analiză
  #Eurostat.

Interested in #eusilc?
#SPSS, #Stata, and #Rstats routines to transform the raw data of EU-SILC into system files are now available for the most recent EU-SILC release 2024-release1: https://www.gesis.org/en/missy/materials/EU-SILC/setups

Interested in #eusilc?
#SPSS, #Stata, and #Rstats routines to transform the raw data of EU-SILC into system files are now available for the most recent EU-SILC release 2024-release1: www.gesis.org/en/missy/mat...
#eurostat
GESIS: MISSY - Setups: EU-SILC
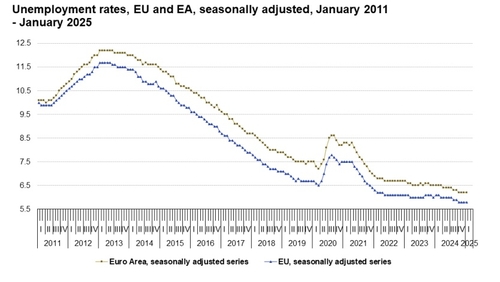
Eurozone's January unemployment rate holds steady at 6.2%, outperforming market expectations and showing a year-on-year improvement, signaling continued labor market resilience in the region.
#YonhapInfomax #EurozoneUnemployment #Eurostat #LaborMarket #EconomicIndicators #MarketExpectations #Economics #FinancialMarkets #Banking #Securities #Bonds #StockMarket
https://en.infomaxai.com/news/articleView.html?idxno=52876


Internetzugang in der EU: In welchen Regionen ist der Anteil der Menschen, die noch nie das Internet genutzt haben, am höchsten. Und wo gab es die stärksten Veränderungen. – Eurostat Jahrbuch 2024 mit Zahlen aus 2023.
https://op.europa.eu/en/publication-detail/-/publication/86bdd83d-7fa3-11ef-a67d-01aa75ed71a1/language-en
#EU #Internet #Regions #Eurostat


Euro area #employment +0.1% in Q4 2024, +0.6% compared with Q4 2023: flash estimate from #Eurostat https://ec.europa.eu/eurostat/en/web/products-euro-indicators/w/2-14022025-AP
---
https://nitter.privacydev.net/EU_Eurostat/status/1890340216474595560#m
Euro area #GDP +0.1% in Q4 2024, +0.9% compared with Q4 2023: flash estimate from #Eurostat https://ec.europa.eu/eurostat/en/web/products-euro-indicators/w/2-14022025-AP
---
https://nitter.privacydev.net/EU_Eurostat/status/1890340210938171410#m
Winter poverty: The EU countries that struggle the most to heat their homes https://www.byteseu.com/732160/ #CostOfLiving #Europe #EuropeanUnion #Eurostat #Inflation #poverty #winter

Finland and Ireland report lowest rates as eurozone inflation picks up https://www.byteseu.com/720834/ #annual #area #authority #bank #baseline #Central #change #consumer #disinflation #driver #ECB #eu #euro #European #Eurostat #Eurozone #Finland #Finnish #Finns #Inflation #Ireland #lowest #monetary #price #rate #service #Union #YearOnYear

Euro area #GDP stable in Q4 2024, +0.9% compared with Q4 2023: preliminary flash estimate from #Eurostat https://ec.europa.eu/eurostat/en/web/products-euro-indicators/w/2-30012025-AP
---
https://nitter.privacydev.net/EU_Eurostat/status/1884904391150567461#m
https://www.europesays.com/1790505/ EUROLIIDU REKORD ⟩ Eestis on suur osa pensionöridest sunnitud vabaduse nautimise asemel tööl käima #baltikum #Eesti #estonia #EuroopaLiidu #eurostat #Hispaania #holland #Kreeka #läti #Leedu #luminor #norra #oecd #pension #pensionär #pensionärid #Rumeenia #Šveits #Taani #Uudised #VahurMadisson

RT by @EU_Eurostat: https://cros.ec.europa.eu/book-page/issue-27-harnessing-big-data-tourism-statistics-challenges-and-future-steps
#DataScience #Newdatasource #ESS #BigData #statistics #Eurostat #data #AskEurostat
@EU_Eurostat, @EU_EMOS, @istat_en, @IAOS_Stat, @RoyalStatSoc, @UNECE, @UNStats
cros.ec.europa.eu/book-page/…
#DataScience #Newdatasource #ESS #BigData #statistics #Eurostat #data #AskEurostat
@EU_Eurostat, @EU_EMOS, @istat_en, @IAOS_Stat, @Royal...
---
https://nitter.privacydev.net/EssnetWin/status/1881695916127875519#m
RT by @EU_Eurostat: https://win2025.stat.gov.pl/
@EU_Eurostat, @istat_en, @EU_EMOS, @IAOS_Stat, @RoyalStatSoc, @UNECE, @UNStats
#DataScience #Newdatasource #ESS #BigData #statistics #Eurostat #data #AskEurostat
---
https://nitter.privacydev.net/EssnetWin/status/1879793033115562114#m