Why did I do this today? Because of the ZEC calculation I mention in #1 .
The Zero Emissions Commitment = how much warming can be expected after CO2zero.
That 10 year lag after a CO2 pulse would locate the span for ZEC at 10 years.
@MichaelEMann says in this conversation with the director of #DontLookUp , that the oceans are going to keep taking up lots of CO2 for quite a while – which, he says, counters the warming tail and shortens it. http://redgreenandblue.org/2022/01/19/prof-michael-mann-speaks-dont-look-director-adam-mckay/
My chart above says: there is no warming tail.
And my assumption in #1 says: if the weakening AMOC leads to less and less ocean CO2 uptake, like the paper states, our continued emissions, should they continue, increase the CO2 growth peaks.
But that's not going to directly immediately changing the amplitude of the °C anomaly, as I found out in my chart above.
Okay.
Now to the thing I had actually planned for today: plotting Antarctic CO2 and Greenland's local temperature from before the Younger Dryas.


 - In der südöstlichen Provinz Nord-Gyeongsang sind mindestens 27 Menschen gestorben und Hunderte von Gebäuden zerstört worden. Der Katastrophenschutzbeauftragte des Landes sagte, die Brände hätten die „harte Realität“ der globalen Erwärmung offengelegt.
 https://www.theguardian.com/world/2025/mar/27/south-korea-fires-death-toll-rises-worst-in-history
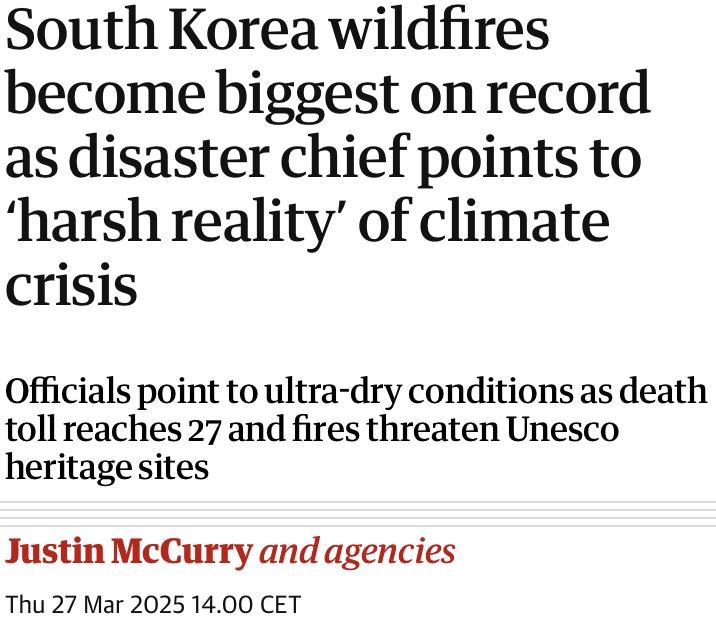


 CrinstamCamp


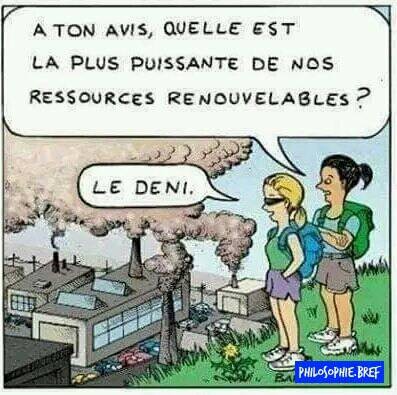


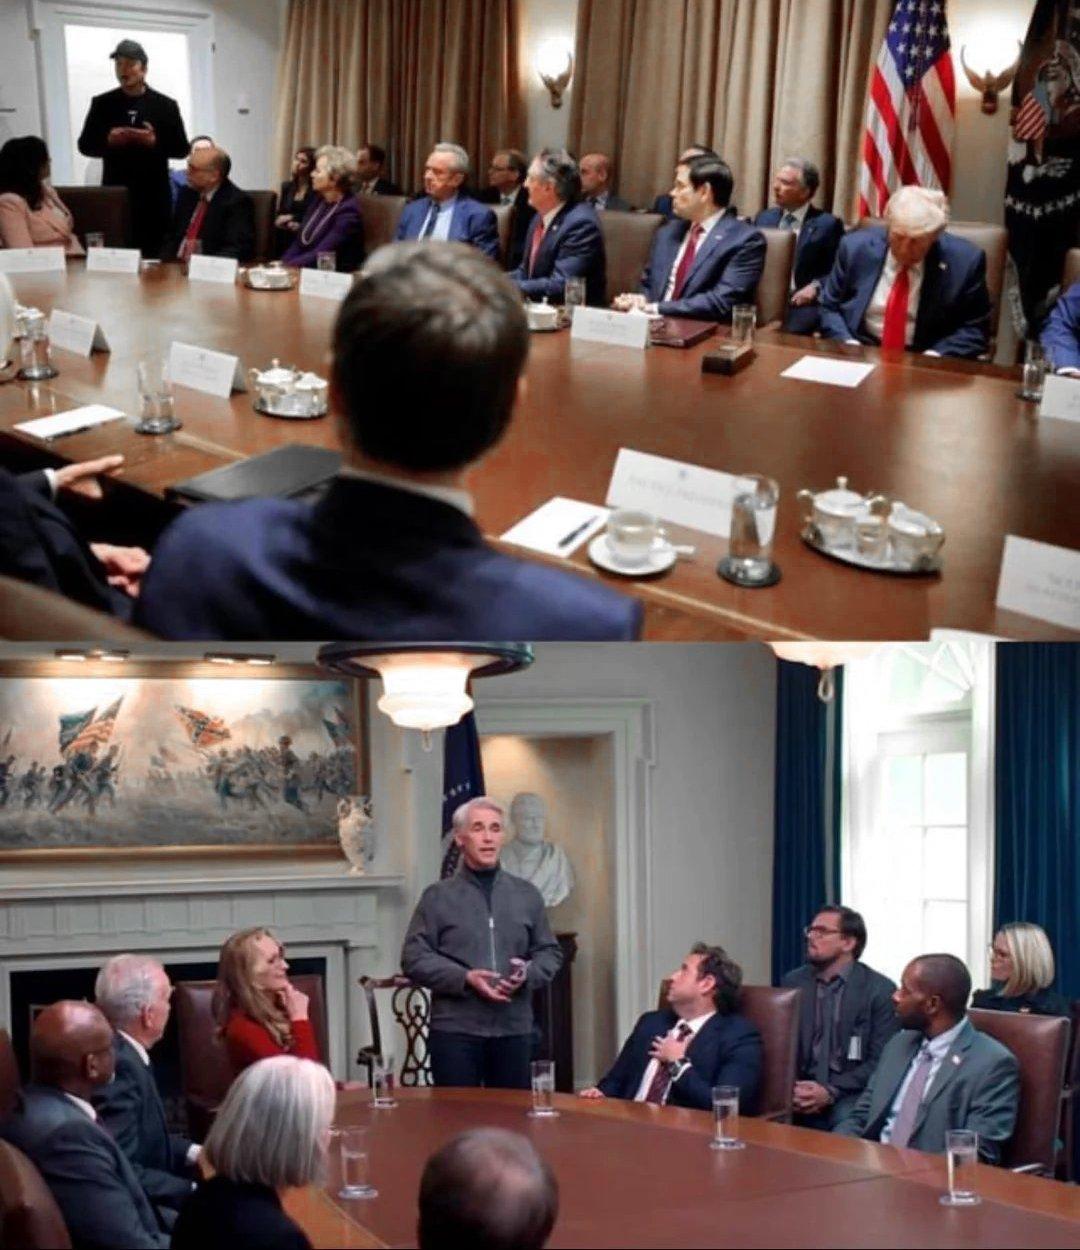
. Au centre le chien dit : climate changé? It's a hoax. Référence a trump campagne 2016")