I have a #GDAL / #QGIS question for the #GIS commnunity in the Fediverse #askFedi concerning the use of geolocation arrays in raster datsets, i.e. in bands the hold (for example) the latitude and longitude of each cell in the raster.
I'm used to produce datasets in UTM format, for which adding the appropriate georeference metadata is simple. However, in this case I'm producing a raster dataset where the cells are distributed in a “warped” area (think aerial imagery with non-affine transform from data matrix to geo coordinates). I have arrays holding resp. the latitude and longitude of each pixel, and can add it to the dataset, I can specify the GCRS (lat/lon WGS84), but I can't seem to be able to find the metadata to add to the raster so that the goelocation arrays are correctly identified as such.
Online there seems to be only sparse documentation about this, generally implying that this is only supported for specific dataset types in specific formats (usually, the standard format from common satellite data) and the only pages I've found on how to “roll your own” refer to a single old-ish mailing list contribution that recommends the use of a sidecar VRT file. Are there any more modern solutions possible?


 myself. Preferably using


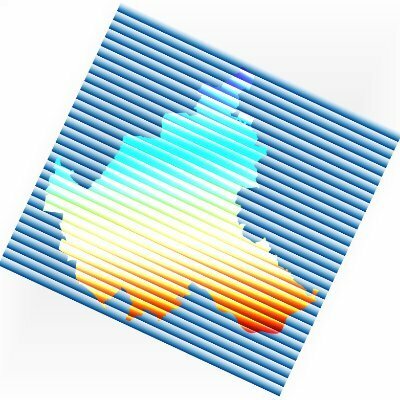
 Showing Kilimanjaro National Park Terrain
 found In Tanzania
  ,Which hosts The Highest peak in Africa dataset is from @OpenTopography (COP30)
 ")


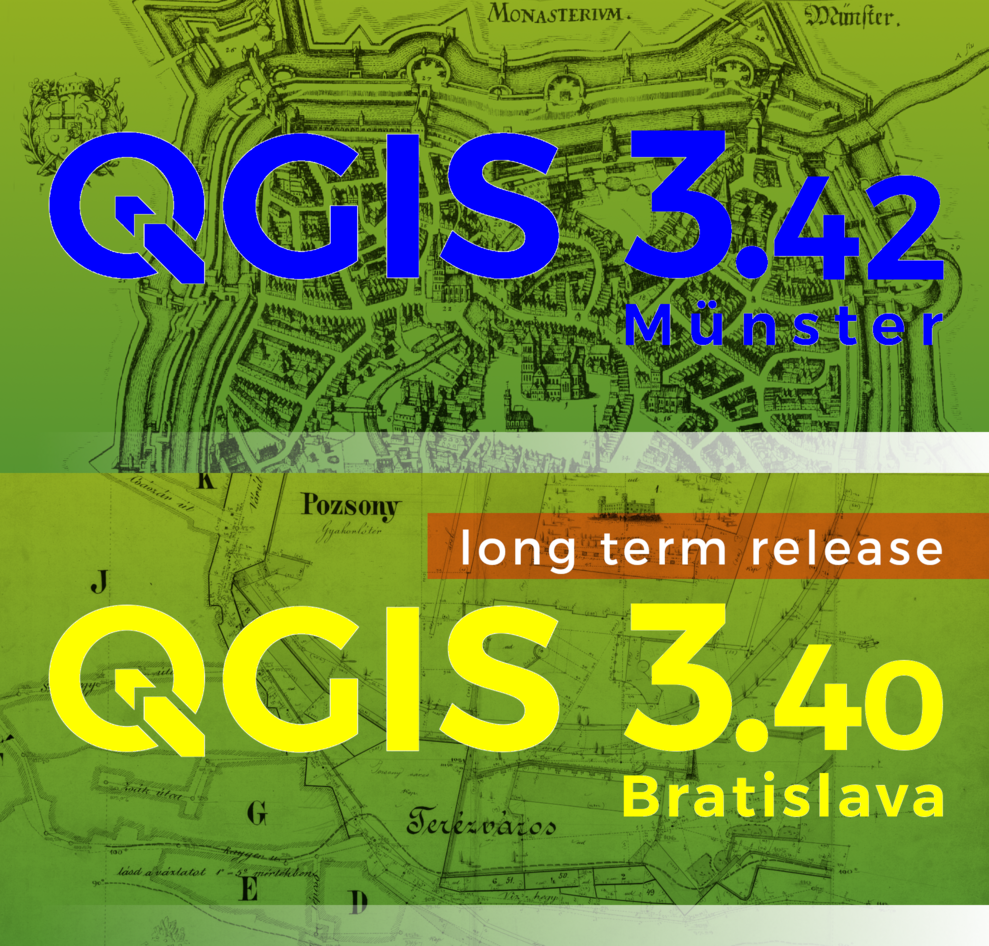
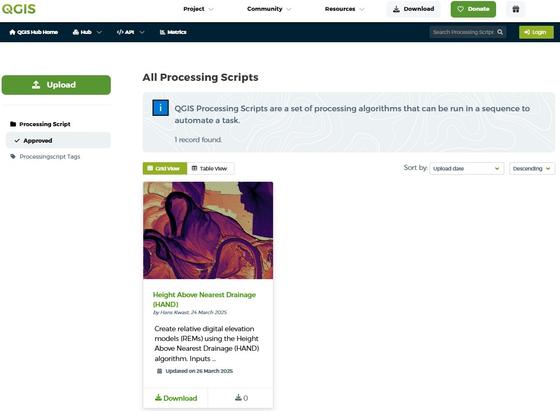
 QGIS Processing Scripts can now be shared via the QGIS Resources Hub!
 Learn more:
 Watch the tutorial video:
  Follow the step-by-step guide:


 Today Oslandia and partners ( e.g.
  and share the info !
 Details here :
  New regulations (e.g. CRA, NIS2), threat increase, IT requirement, legacy… Many reasons for
  We will work on tech & organizational aspects, and collaborate closely with the user and dev community.
 Share the word !

 We are an opensource editor of
  Our team of ~30 (great) people is distributed all over France & full remote is at the heart of our organization.
 More info :
  We will post company updates and GIS-related infos