Building A DIY Tornado Tower - A tornado can be an awe-inspiring sight, but it can also flip your car, trash your... - https://hackaday.com/2025/04/14/building-a-diy-tornado-tower/ #flowvisualization #tornadotower #science #tornado #vortex

Building A DIY Tornado Tower - A tornado can be an awe-inspiring sight, but it can also flip your car, trash your... - https://hackaday.com/2025/04/14/building-a-diy-tornado-tower/ #flowvisualization #tornadotower #science #tornado #vortex
Salt Fingers
Any time a fluid under gravity has areas of differing density, it convects. We’re used to thinking of this in terms of temperature — “hot air rises” — but temperature isn’t the only source of convection. Differences in concentration — like salinity in water — cause convection, too. This video shows a special, more complex case: what happens when there are two sources of density gradient, each of which diffuses at a different rate.
The classic example of this occurs in the ocean, where colder fresher water meets warmer, saltier water (and vice versa). Cold water tends to sink. So does saltier water. But since temperature and salinity move at different speeds, their competing convection takes on a shape that resembles dancing, finger-like plumes as seen here. (Video and image credit: M. Mohaghar et al.)
Twisting in the Flow
What happens to liquid crystals in a flow? In this video, researchers look at liquid crystals flowing through the narrow gap of a microfluidic device. Initially, all the crystals are oriented the same way, as if they are logs rolling down a river. But as the flow rate increases, narrow lines appear in the flow, followed by disordered regions, and, eventually, a new configuration: vertical bands streaking the left-to-right flow. The colors, in this case, indicate the orientation of the liquid crystals. As the researchers show, the crystals collectively twist to form the spontaneous bands. (Video and image credit: D. Jia and I. Bischofberger)
Simulating a Sneeze
Sneezing and coughing can spread pathogens both through large droplets and through tiny, airborne aerosols. Understanding how the nasal cavity shapes the aerosol cloud a sneeze produces is critical to understanding and predicting how viruses could spread. Toward that end, researchers built a “sneeze simulator” based on the upper respiratory system’s geometry. With their simulator, the team mimicked violent exhalations both with the nostrils open and closed — to see how that changed the shape of the aerosol cloud produced.
The researchers found that closed nostrils produced a cloud that moved away along a 18 degree downward tilt, whereas an open-nostril cloud followed a 30-degree downward slope. That means having the nostrils open reduces the horizontal spread of a cloud while increasing its vertical spread. Depending on the background flow that will affect which parts of a cloud get spread to people nearby. (Image and research credit: N. Catalán et al.; via Physics World)
Imaging a New Era of Supersonic Travel
Supersonic commercial travel was briefly possible in the twentieth century when the Concorde flew. But the window-rattling sonic boom of that aircraft made governments restrict supersonic travel over land. Now a new generation of aviation companies are revisiting the concept of supersonic commercial travel with technologies that help dampen the irritating effects of a plane’s shock waves.
One such company, Boom Supersonic, partnered with NASA to capture the above schlieren image of their experimental XB-1 aircraft in flight. The diagonal lines spreading from the nose, wings, and tail of the aircraft mark shock waves. It’s those shock waves’ interactions with people and buildings on the ground that causes problems. But the XB-1 is testing out scalable methods for producing weaker shock waves that dissipate before reaching people down below, thus reducing the biggest source of complaints about supersonic flight over land. (Image credit: Boom Supersonic/NASA; via Quartz)
Salt Affects Particle Spreading
Microplastics are proliferating in our oceans (and everywhere else). This video takes a look at how salt and salinity gradients could affect the way plastics move. The researchers begin with a liquid bath sandwiched between a bed of magnets and electrodes. Using Lorentz forcing, they create an essentially 2D flow field that is ordered or chaotic, depending on the magnets’ configuration. Although it’s driven very differently, the flow field resembles the way the upper layer of the ocean moves and mixes.
The researchers then introduce colloids (particles that act as an analog for microplastics) and a bit of salt. Depending on the salinity gradient in the bath, the colloids can be attracted to one another or repelled. As the team shows, the resulting spread of colloids depends strongly on these salinity conditions, suggesting that microplastics, too, could see stronger dispersion or trapping depending on salinity changes. (Video and image credit: M. Alipour et al.)
Ultra-Soft Solids Flow By Turning Inside Out
Can a solid flow? What would that even look like? Researchers explored these questions with an ultra-soft gel (think 100,000 times softer than a gummy bear) pumped through a ring-shaped annular pipe. Despite its elasticity — that tendency to return to an original shape that distinguishes solids from fluids — the gel does flow. But after a short distance, furrows form and grow along the gel’s leading edge.
Front view of an ultra-soft solid flowing through an annular pipe. The furrows forming along the face of the gel are places where the gel is essentially turning itself inside out.Since the gel alongside the pipe’s walls can’t slide due to friction, the gel flows by essentially turning itself inside out. Inner portions of the gel flow forward and then split off toward one of the walls as they reach the leading edge. This eversion builds up lots of internal stress in the gel, and furrowing — much like crumpling a sheet of paper — relieves that stress. (Image and research credit: J. Hwang et al.; via APS News)
A Drop’s Shape Effects
Falling raindrops get distorted by the air rushing past them, ultimately breaking large droplets into many smaller ones. This research poster shows how variable this process is by showing two different raindrops, both of the same 8-mm initial diameter. On the left, the drop is prolate — longer than it is wide — and on the right, the drop is oblate — wider than it is long. Moving from bottom to top, we see a series of snapshots of each drop’s shape as it deforms and, eventually, breaks into smaller drops. The overall process is similar for each: the drop flattens, dimples, and then inflates like a sail, with part of the drop thinning into a sheet and ultimately breaking into smaller droplets. Yet, each drop’s specific details are entirely different. (Image credit: S. Dighe et al.)
Kolmogorov Turbulence
Turbulent flows are ubiquitous, but they’re also mindbogglingly complex: ever-changing in both time and space across length scales both large and small. To try to unravel this complexity, scientists use simplified model problems. One such simplification is Kolmogorov flow: an imaginary flow where the fluid is forced back and forth sinusoidally. This large-scale forcing puts energy into the flow that cascades down to smaller length scales through the turbulent energy cascade. Here, researchers depict a numerical simulation of a turbulent Kolmogorov flow. The colors represent the flow’s vorticity field. Notice how your eye can pick out both tiny eddies and larger clusters in the flow; those patterns reflect the multi-scale nature of turbulence. (Image credit: C. Amores and M. Graham)
Bubbly Tornadoes Aspin
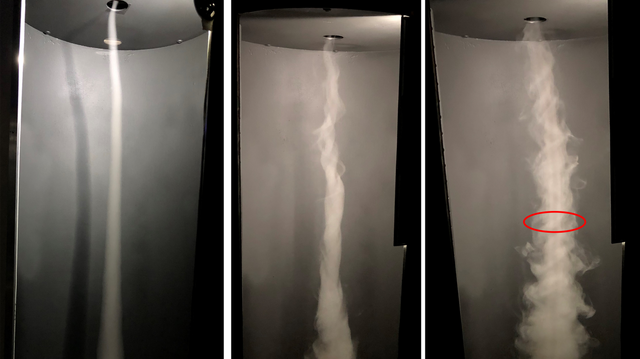
Rotating flows are full of delightful surprises. Here, the folks at the UCLA SpinLab demonstrate the power a little buoyancy has to liven up a flow. Their backdrop is a spinning tank of water; it’s been spinning long enough that it’s in what’s known as solid body rotation, meaning that the water in the tank moves as if it’s one big spinning object. To demonstrate this, they drop some plastic tracers into the water. These just drop to the floor of the tank without fluttering, showing that there’s no swirling going on in the tank. Then they add Alka-Seltzer tablets.
As the tablets dissolve, they release a stream of bubbles, which, thank to buoyancy, rise. As the bubbles rise, they drag the surrounding water with them. That motion, in turn, pulls water in from the surroundings to replace what’s moving upward. That incoming water has trace amounts of vorticity (largely due to the influence of friction near the tank’s bottom). As that vorticity moves inward, it speeds up to conserve angular momentum. This is, as the video notes, the same as a figure skater’s spin speeding up when she pulls in her arms. The result: a beautiful, spiraling bubble-filled vortex. (Video and image credit: UCLA SpinLab)
Visualizing Unstable Flames
Inside a combustion chamber, temperature fluctuations can cause sound waves that also disrupt the flow, in turn. This is called a thermoacoustic instability. In this video, researchers explore this process by watching how flames move down a tube. The flame fronts begin in an even curve that flattens out and then develops waves like those on a vibrating pool. Those waves grow bigger and bigger until the flame goes completely turbulent. Visually, it’s mesmerizing. Mathematically, it’s a lovely example of parametric resonance, where the flame’s instability is fed by system’s natural harmonics. (Video and image credit: J. Delfin et al.; research credit: J. Delfin et al. 1, 2)
“Kirigami Sun”
Kirigami is a variation of origami in which paper can be cut as well as folded. Here, researchers look at flow through a cut kirigami sheet and how that flow changes with the cuts’ length. In the top central image, white lines mark the paper boundaries. As the cut gaps get larger, flow through them transitions from a continuous jet to swirling vortex shedding. Along the bottom, we see similar patterns emerge in the wake of uniformly-cut sheets, too. On the right, the flow comes through in jets; moving leftward, it transitions to an unsteady vortex shedding flow. (Image credit: D. Caraeni and Y. Modarres-Sadeghi)
“My Own Galaxy”
Fungal spores sketch out minute air currents in this shortlisted photograph by Avilash Ghosh. The moth atop a mushroom appears to admire the celestial view. In the largely still air near the forest floor, mushrooms use evaporation and buoyancy to generate air flows capable of lifting their spores high enough to catch a stray breeze. (Image credit: A. Ghosh/CUPOTY; via Colossal)
“Lively”
In “Lively,” filmmaker Christopher Dormoy zooms in on ice. He shows ice forming and melting, capturing bubbles and their trails, as well as the subtle flows that go on in and around the ice. By introducing blue dye, he highlights some of the internal flows we would otherwise miss. (Video and image credit: C. Dormoy)
How CO2 Gets Into the Ocean
Our oceans absorb large amounts of atmospheric carbon dioxide. Liquid water is quite good at dissolving carbon dioxide gas, which is why we have seltzer, beer, sodas, and other carbonated drinks. The larger the surface area between the atmosphere and the ocean, the more quickly carbon dioxide gets dissolved. So breaking waves — which trap lots of bubbles — are a major factor in this carbon exchange.
This video shows off numerical simulations exploring how breaking waves and bubbly turbulence affect carbon getting into the ocean. The visualizations are gorgeous, and you can follow the problem from the large-scale (breaking waves) all the way down to the smallest scales (bubbles coalescing). (Video and image credit: S. Pirozzoli et al.)
Flow Behind Viscous Fingers
Nature is full of branching patterns: trees, lighting, rivers, and more. In fluid dynamics, our prototypical branching pattern is the Saffman-Taylor instability, created when a less viscous fluid is injected into a more viscous one in an confined space. Most attention in this problem has gone to the branching interface where the two fluids meet, but recently, a team has examined the flow away from the fingers by alternately injecting dyed and undyed fluid to visualize what goes on. That’s what we see here. Notice how the central dye rings, far from the branching fingers, still appear circular. Yet, even a few centimeters away from the fingers, the dye is starting to show ripples that correspond to the fingers. That’s an indication that the pressure gradient generated at the tips of the fingers is pretty far-reaching! (Image and research credit: S. Gowen et al.)
The Mystery of the Binary Droplet
What goes on inside an evaporating droplet made up of more than one fluid? This is a perennially fascinating question with lots of permutations. In this one, researchers observed water-poor spots forming around the edges of an evaporating drop, almost as if the two chemicals within the drop are physically separating from one another (scientifically speaking, “undergoing phase separation“). To find out if this was really the case, they put particles into the drop and observed their behavior as the drop evaporated. What they found is that this is a flow behavior, not a phase one. The high concentration of hexanediol near the edge of the drop changes the value of surface tension between the center and edge of the drop. And that change is non-monotonic, meaning that there’s a minimum in the surface tension partway along the drop’s radius. That surface tension minimum is what creates the separated regions of flow. (Video and image credit: P. Dekker et al.; research pre-print: C. Diddens et al.)
Within a Drop
In this macro video, various chemical reactions swirl inside a single dangling droplet. Despite its tiny size, quite a lot can go on in a drop like this. Both the injection of chemicals and the chemical reactions themselves can cause the flows we see here. Surface tension variations and capillary waves on the exterior of the drop can play a role, too. Just because a flow is tiny doesn’t mean it’s simple. (Video and image credit: B. Pleyer; via Nikon Small World in Motion)
Chemical reactions swirl within a single, hanging droplet.